Writeup of NYC Traffic Visualization
See the final product here
I stumbled on a feed of traffic speeds provided by New York City Department of Transportation (DOT) and had fun getting a visualization running using Mike Bostock's excellent D3. Though a small project, I was both surprised and pleased to face difficulties and design decisions that are typical of larger systems and also touch on past and present interests.
Github as an Edge Cache
Because I need to poll a remote service that doesn't have CORS enabled, I'm restricted by the same-origin policy of browsers and can't poll the service from the browser client. I had planned to have everything hosted on Github to avoid headaches (it's free! uptime almost-all-the-time!), but now I realized I needed to run a service to serve as a proxy between the DOT server and the browser. But wait -- I could still use Github! I could use my laptop to poll the DOT service, pipe to a file, commit, and push. Which is exactly what I ended up doing:
I Seem To Spend Most Days Converting Files From One Format To Another
Firstly, I initially tried to convert a shapefile I acquired from NYC Open Data to GeoJSON, but could never get it to work. After two nights of reading Stack Overflows and exploring dense ogr2ogr documentation, I found Derek Willis of the Times had already made NYC maps available, so I Curled that and went on my way. I mention this to others who may stumble on this; it will become a project in itself to learn the motivations of ogr2ogr and nomenclature of projections, and aimless experimentation will be rewarded with a blank canvas, so don't commit lightly!
The DOT service provides a TSV (not CSV as listed) with sensor path information and speed on that path. Check out the head of a typical response: The official description of the DOT data can be found here. The path is encoded twice; once as a series of human readable lat-longs, and a second time as a Google Polyline.
Parsing the lat-long string, I found many well-traveled bridges that, until now, I never knew of.
Decoding the Google Polyline instead removed the spurious points and these phantom bridges. The Polyline encoding is clearly better than the string of lat-longs, and though it's hard to say exactly why, I have three immediate reasons:
- It's complete. An additional problem with the lat-long string is that it isn't complete for paths with many points; the string appears to have a max length of 255 characters--will someone offer me a call on that this is VARCHAR(255)?--and so truncates long strings, giving two classes of errors: dropped points and truncated lat-long pairs.
- It's compressed. This reduces the size of network requests for everyone, but touching on the first point, this is the difference between the service providing accurate versus inaccurate responses.
- Someone else has written a decoder (that likely works). I spent a great deal of time fiddling with my decoding of the lat-long string (trim->split on whitespace -> ...) and it mostly worked, but mostly worked in this case was completely broken. After seeing the data was sometimes bad, I bailed and switched the Polyline encoding. If I had started with the Polyline encoding, and the data were bad, I would have found that out quickly--my confidence is greater in Google's public code than in my hand-rolled solution. So use standard serialization formats (and, as a corollary, do not write DSLs!), unless you have an extremely good reason!
I do concede though that human-readable formats make play much more possible; HTTP 1.1 is great fun to work with, and I think a lot of that comes from not having the level of indirection that a non-human-readable format would add.
Smooth things out...
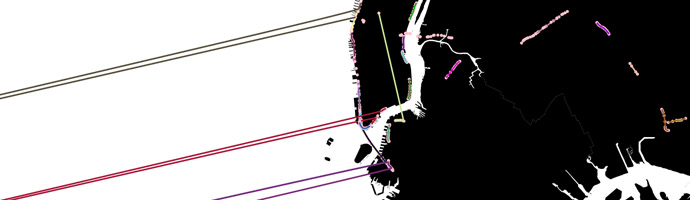
... in space: When drawing the path, I choose not do make a linear interpolation between the sensor points, but a B-spline interpolation to get a smooth, not jagged, path.

... in time: Querying the DOT service and immediately updating the map resulted in a small explosion of activity that quickly diffused with fast cars leaving the map quickly and slow cars persisting. A simple solution was to have a global queue in which the batch of updates are queued; with a small time interval, updates are dequeued. If the queue is exhausted, a call is made to refill it. Even though the average of updates in time is the same, the variance in time is smaller, as they are now uniformly spread in the time interval, instead of an impulse.
That Javascript's arrays can easily be used as a stack reminded me of a nice data structure that I first met in Okasaki's Purely Functional Data Structures: the purely functional queue represented as two stacks.
Here are implementations in Clojure; Javascript, non-functionally; and OCaml:
The nice invariant preserved is that the queue is empty if and only if the front stack is empty. I can't remember if this was in Okasaki or not, but this simplifies the logic greatly.
Fast or Slow, You Can Stay, You Can Go
I mentioned a feature of the map earlier, that cars tend to be either fast or slow, either fleeting or persistent. This seems to be common in computer systems, and moreover, systems typically have some idea of which camp you fall in before you go about your business. HPC clusters often have fast and slow queues to process tasks, and in a different context, Mesos frameworks tend to want to be either a Jehovah's witness or immortal. Another related idea is generational garbage collection, but in this case the system does not a priori know or guess how long an object will live, and the whole point of the system is to discern whether you are fast or slow; if you are a survivor you will continue to be a survivor--ie, you are slow. But actually, this isn't strictly true--there is some prior on how likely an object is to survive--the minor/major eden/surivor/tenured sizing (and other parameters that affect state transitions) effectively encodes this, the probability you will be slow.
This is a feature of the system I wanted to preserve--that the map had a milky way but not at the expensive of its shooting stars. There was a risk that the slow cars wouldn't finish their journey quickly enough, and the number of objects and dom elements being updated would just be too much for my puny browser. Thankfully, the arbitrary parameters I choose to drain the queue seem to do the job, but if they hadn't, my next step would have been to have two queues, slow and fast, and drain these, each at different rates, and possibly dependent on how many cars were already on the map.
Randomness
Lastly, there were two places I played with randomness. Initially, I jittered (ie, add a small amount of noise to the x- and y- coördinates to) the path points so that cars wouldn't overlap, but when I moved to such small cars, this wasn't an issue, and with larger numbers of paths on my screen, for some reason, the jittering contributed to my browser freezing. Secondly, to ensure order of the cars' appearances was not repetitive, I shuffled the batch before I queued them.